Using GIS for Problem-Focused Mapping
earthDECKS was established with a unique mission to harness our collaborative intelligence to address major environmental challenges that require breaking down silos, not only with interactive geographic maps but also with meta-maps, as shown below: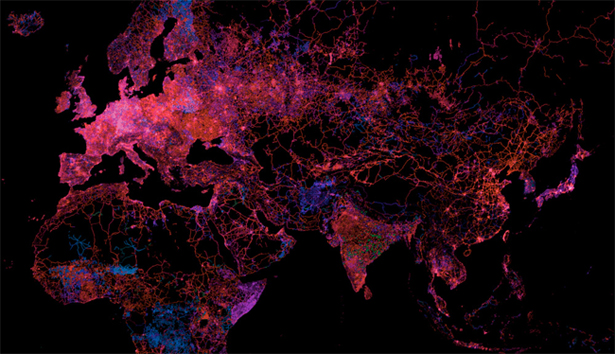
Image Credit: Mapbox, Wired
Above is a meta-map showing how Open Street Map was crowd-sourced, from 2004 on, with more than a million cartographers contributing data. Hot pink areas are newly mapped. Blue and green areas are older. This is a meta-map in that it is a map of a problem-solving process (in this case, it maps the creation of a map). Since the focus of earthDECKS is on collaborative intelligence, the use of maps to diagram a crowd-sourced collaborative problem-solving process (e.g. the development of Open Street Map) offers a powerful way for crowd contributors to track their own progress over time.
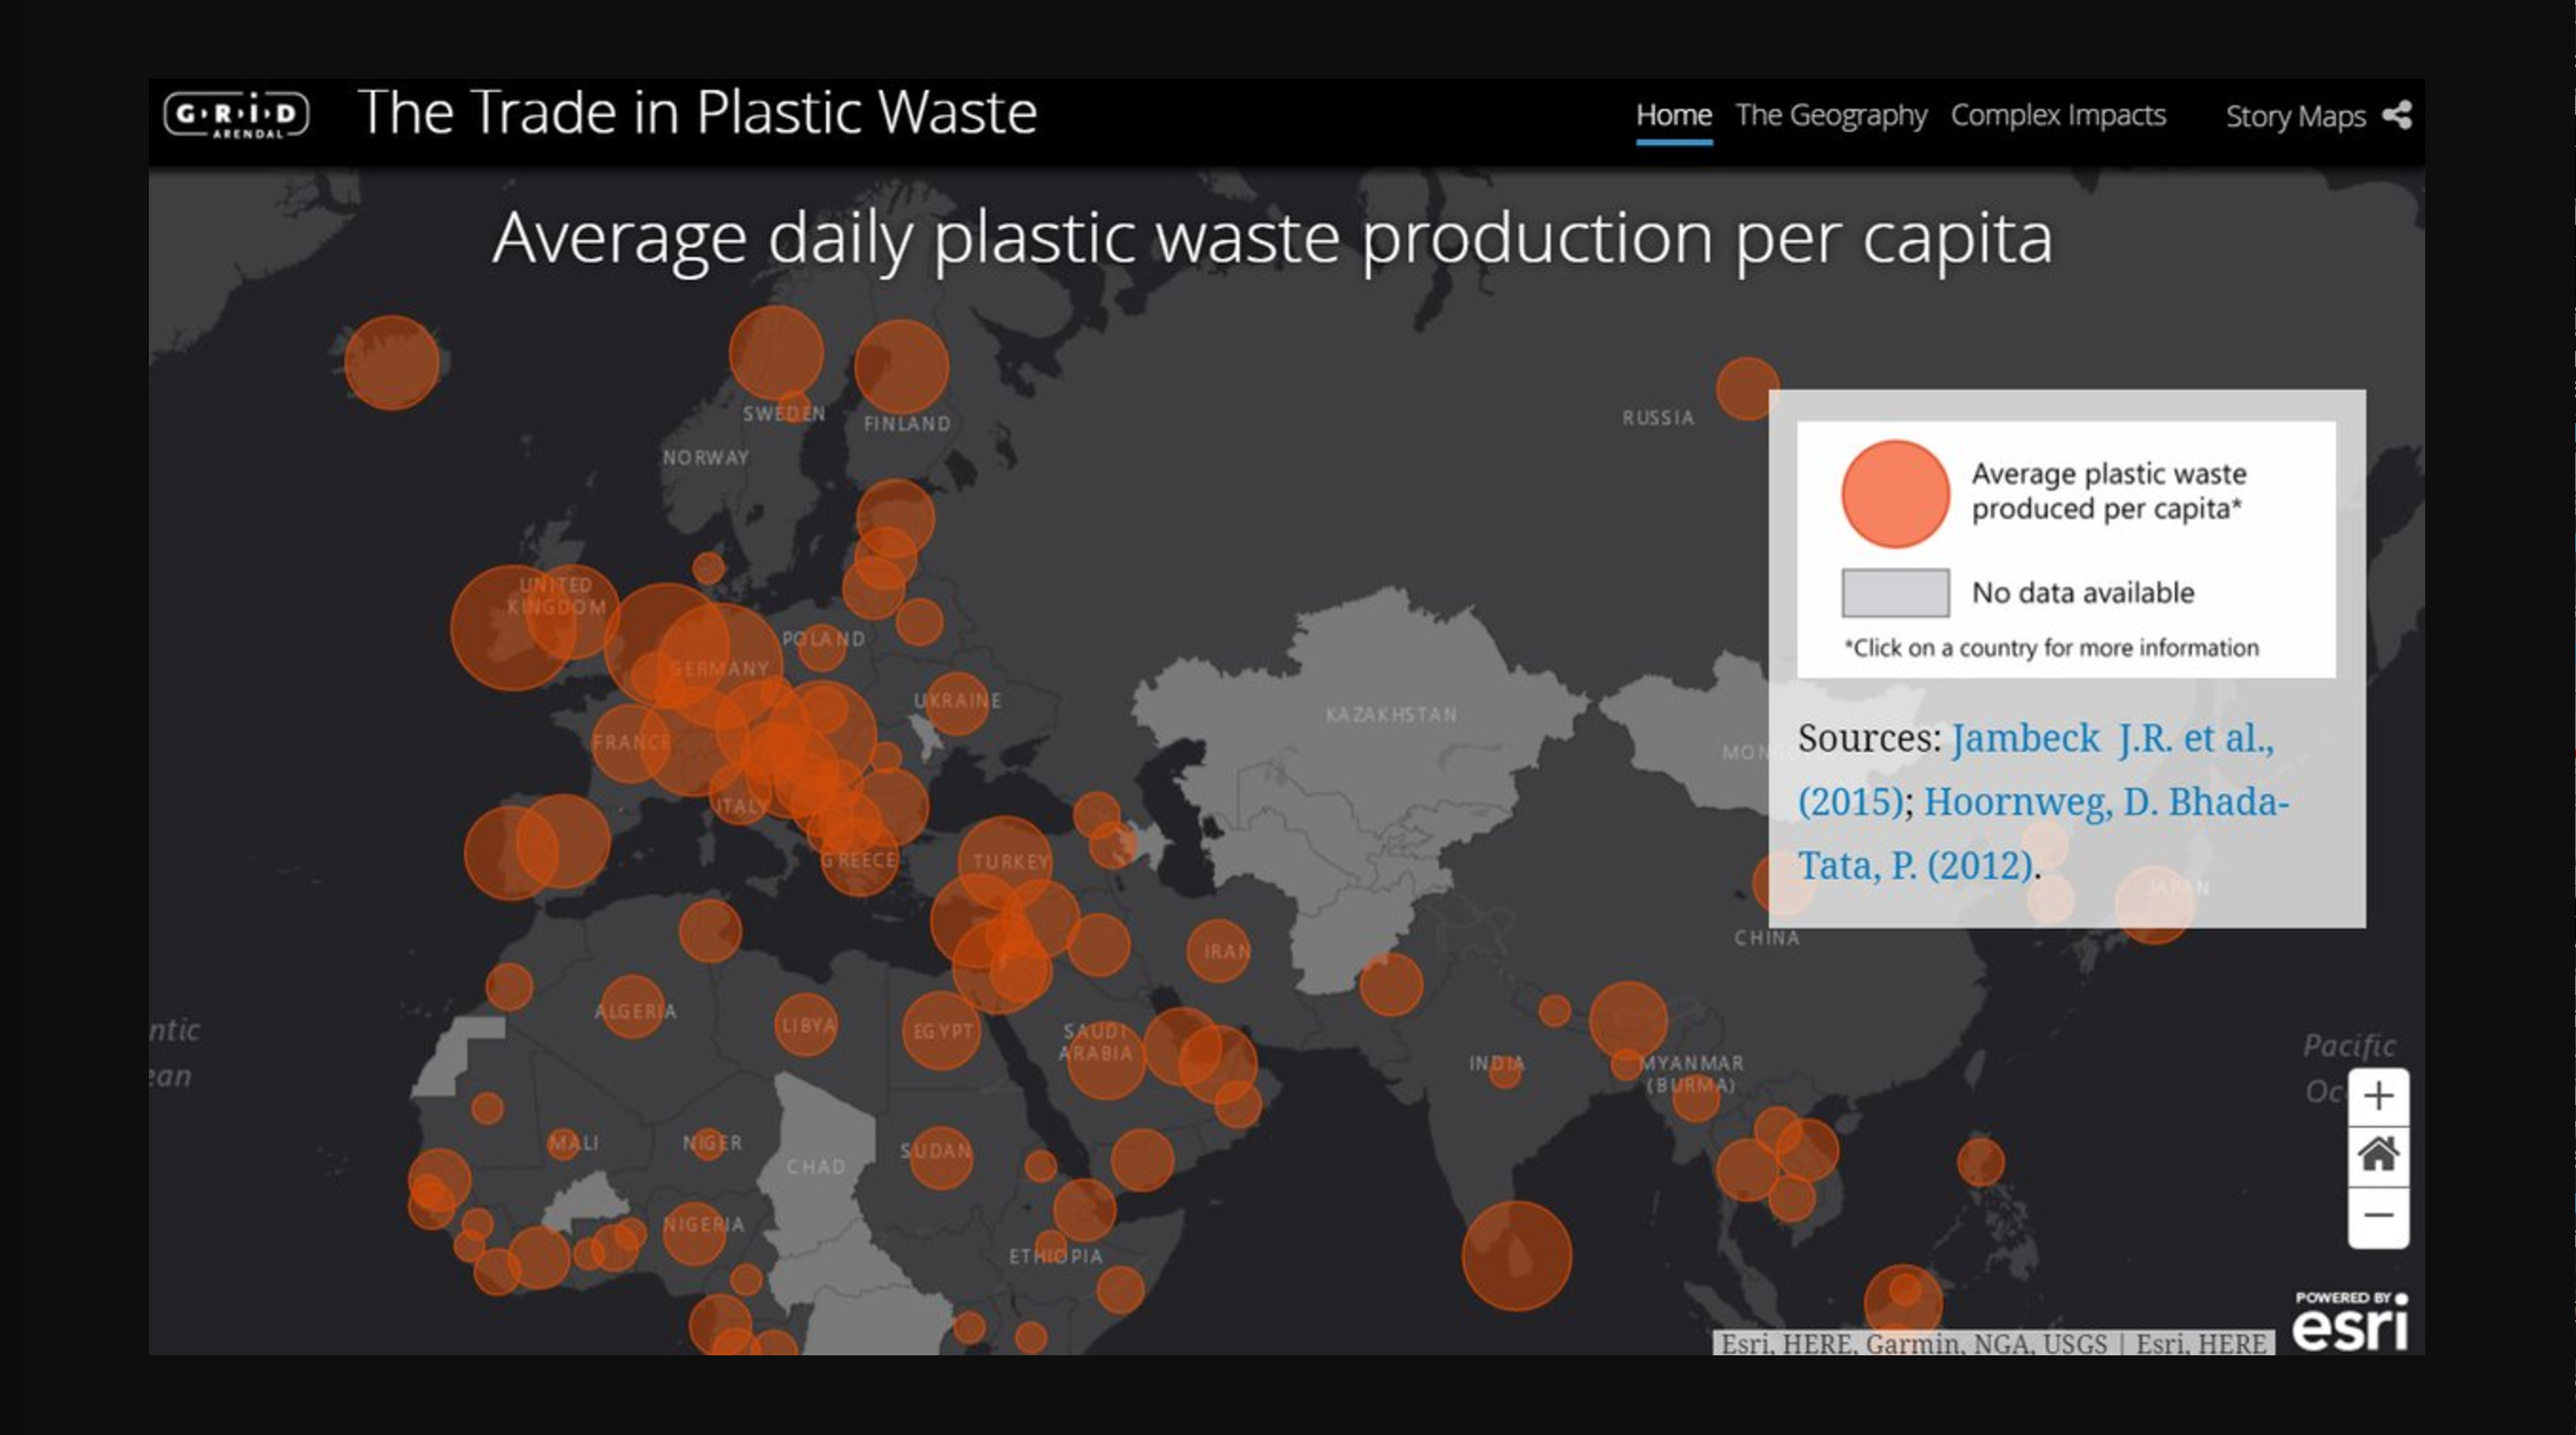
ESRI has a group committed to story-telling with maps. A range of stories have been told, as in this map showing plastic waste per capita:
earthDECKS produces GIS (Geographic Information System) maps in-house to support its collaborations with institutional and private entities on specific problem-solving initiatives, from smart cities embedded in larger regional resilience strategies to innovation networks sharing information across related problem challenges.
Assen Assenov
Assen Assenov develops Mapping and Data Visualization to support innovative technology and sustainable services supporting Collaborative Intelligence.
He holds degrees in Urban Design from Harvard GSD and Architecture from the University of Rome and brings background in urban design, facilities management and architecture, with experience in both the private and public sectors.
He produced some of the first CAFM facilities database for Apple office buildings in Cupertino and extensive mapping database in support of NASA Ames Research Center in its acquisition of the former Moffett Field Air Station, proposing also a campus solution for the International Space University. Assen also supported the development of ESRI’s ArcView GIS application for the Macintosh platform and has maintained an active interest in the GIS domain through work projects, community development and attending conventions.
Witnessing the initial steps of ‘joint venture’ among industry, academia and governments, in the heart of Silicon Valley drove his focus towards implementing methods and strategies for fruitful collaborations.
Assen sees GIS is more than just mapping, as a tool for tracking and caring for our environment.
Team-member Assen Assenov has a background in urban design, facilities management and architecture, in private and public sectors. He holds degrees in Urban Design from Harvard GSD and Architecture from the University of Rome, La Sapienza. His background in GIS mapping goes back to the early ’90s, when he worked on documenting APPLE facilities in Cupertino and collaborating with ESRI to create support for the ArcView program on the Macintosh platform. He collaborated also with NASA Ames to document their facilities at Moffett Field and, during the closure and realignment of the adjacent Navy base, he worked on the proposal to establish at Moffett Field the campus of the first American Space University after the International Space University (ISU) located its main campus in France.
When Assen Assenov worked on conversion of the Naval Air Station (1990-94), he observed how, after the closure of the Navy Base and Onizuka Air Base, Mountain View and Sunnyvale collaborated effectively with various federal agencies, the private sector and academia. Many ‘Joint Venture Silicon Valley’ initiatives were born then, together with a great ‘technology transfer’ program, and the first incubators in some of the former Navy facilities, establishing the triangle — Government, Academia, Industry, heralding the need to address both the promise and the constraints in building a resilience innovation network. In 1994 he wrote one of the earliest ‘blogs’ for the first Federal Geographic Technology Conference, held in Washington, D.C. to consider how federally produced data could be linked to geographic locations, appropriately managed, used and distributed.

Massimiliano Roda, an Italian Architect and Urbanist specializing in Geographic Information Systems, environmental planning, and urban green infrastructure, works with the University of Rome, La Sapienza, developing models for smart cities and sustainable urban transportation infrastructure using progressive GIS mapping solutions.
Maps allow viewers to visualize rapidly how small municipalities have melded into co-dependent metropolises, demanding strategies for resilience that transcend municipal boundaries to engage the region.
The map below, by Assenov and Roda, shows how the Boston Metropolitan Region is composed of many interlocked puzzle pieces. The map may be seen as a basic gameboard, to be developed to address specific regional challenges of this Metropolitan Region through participatory mapping, defined by the UK National Centre for Public Engagement as a “group-based qualitative research method” that gives participants freedom to shape discussion on a given topic with minimal intervention from researchers.

The map above can be seen as the game board at the start of an earthDECKS problem-solving “game,” the canvas on which stakeholders engage to address the challenges of their town. For example, imagine using the map as a tool to work on early warning systems to engage the community to address alternative projections for sea level rise in Boston. Boston was named one of the Rockefeller Foundation Resilient Cities. 2o15 was a year for raising awareness of the potential devastating impacts of sea level rise and proposing alternative solutions to address this problem. The map below overlays a worst case scenario for flooding in Boston if sea level rise is 7.5 feet.
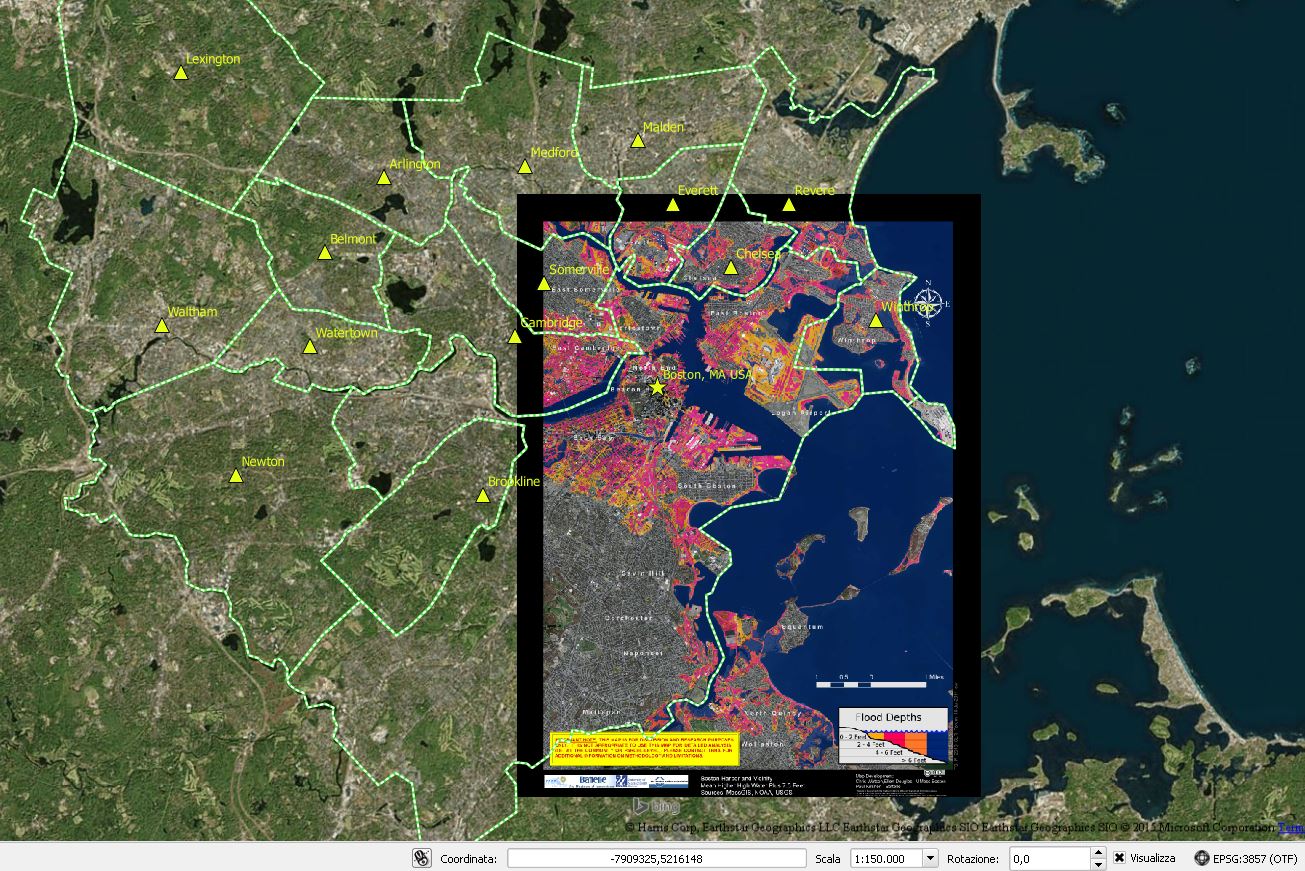
Flooding data: The Boston Harbor Association
Mapping can generate a rich understanding of the connections between people, places and organisations over space and/or time.” In the past decade participatory mapping has been examined by a range of organizations as a powerful tool for community engagement in problem-solving. NOAA (US National Oceanic Atmospheric Research Agency) has studied the use of participatory mapping for coastal regions. The term is used broadly to characterize a process where the problem-solvers participate in mapping a problem solution.
There is growing interest in visualization to stimulate community participation and maps vary widely in style and content. For example, this in the ESRI collections of maps that tell stories is this one of National Parks:
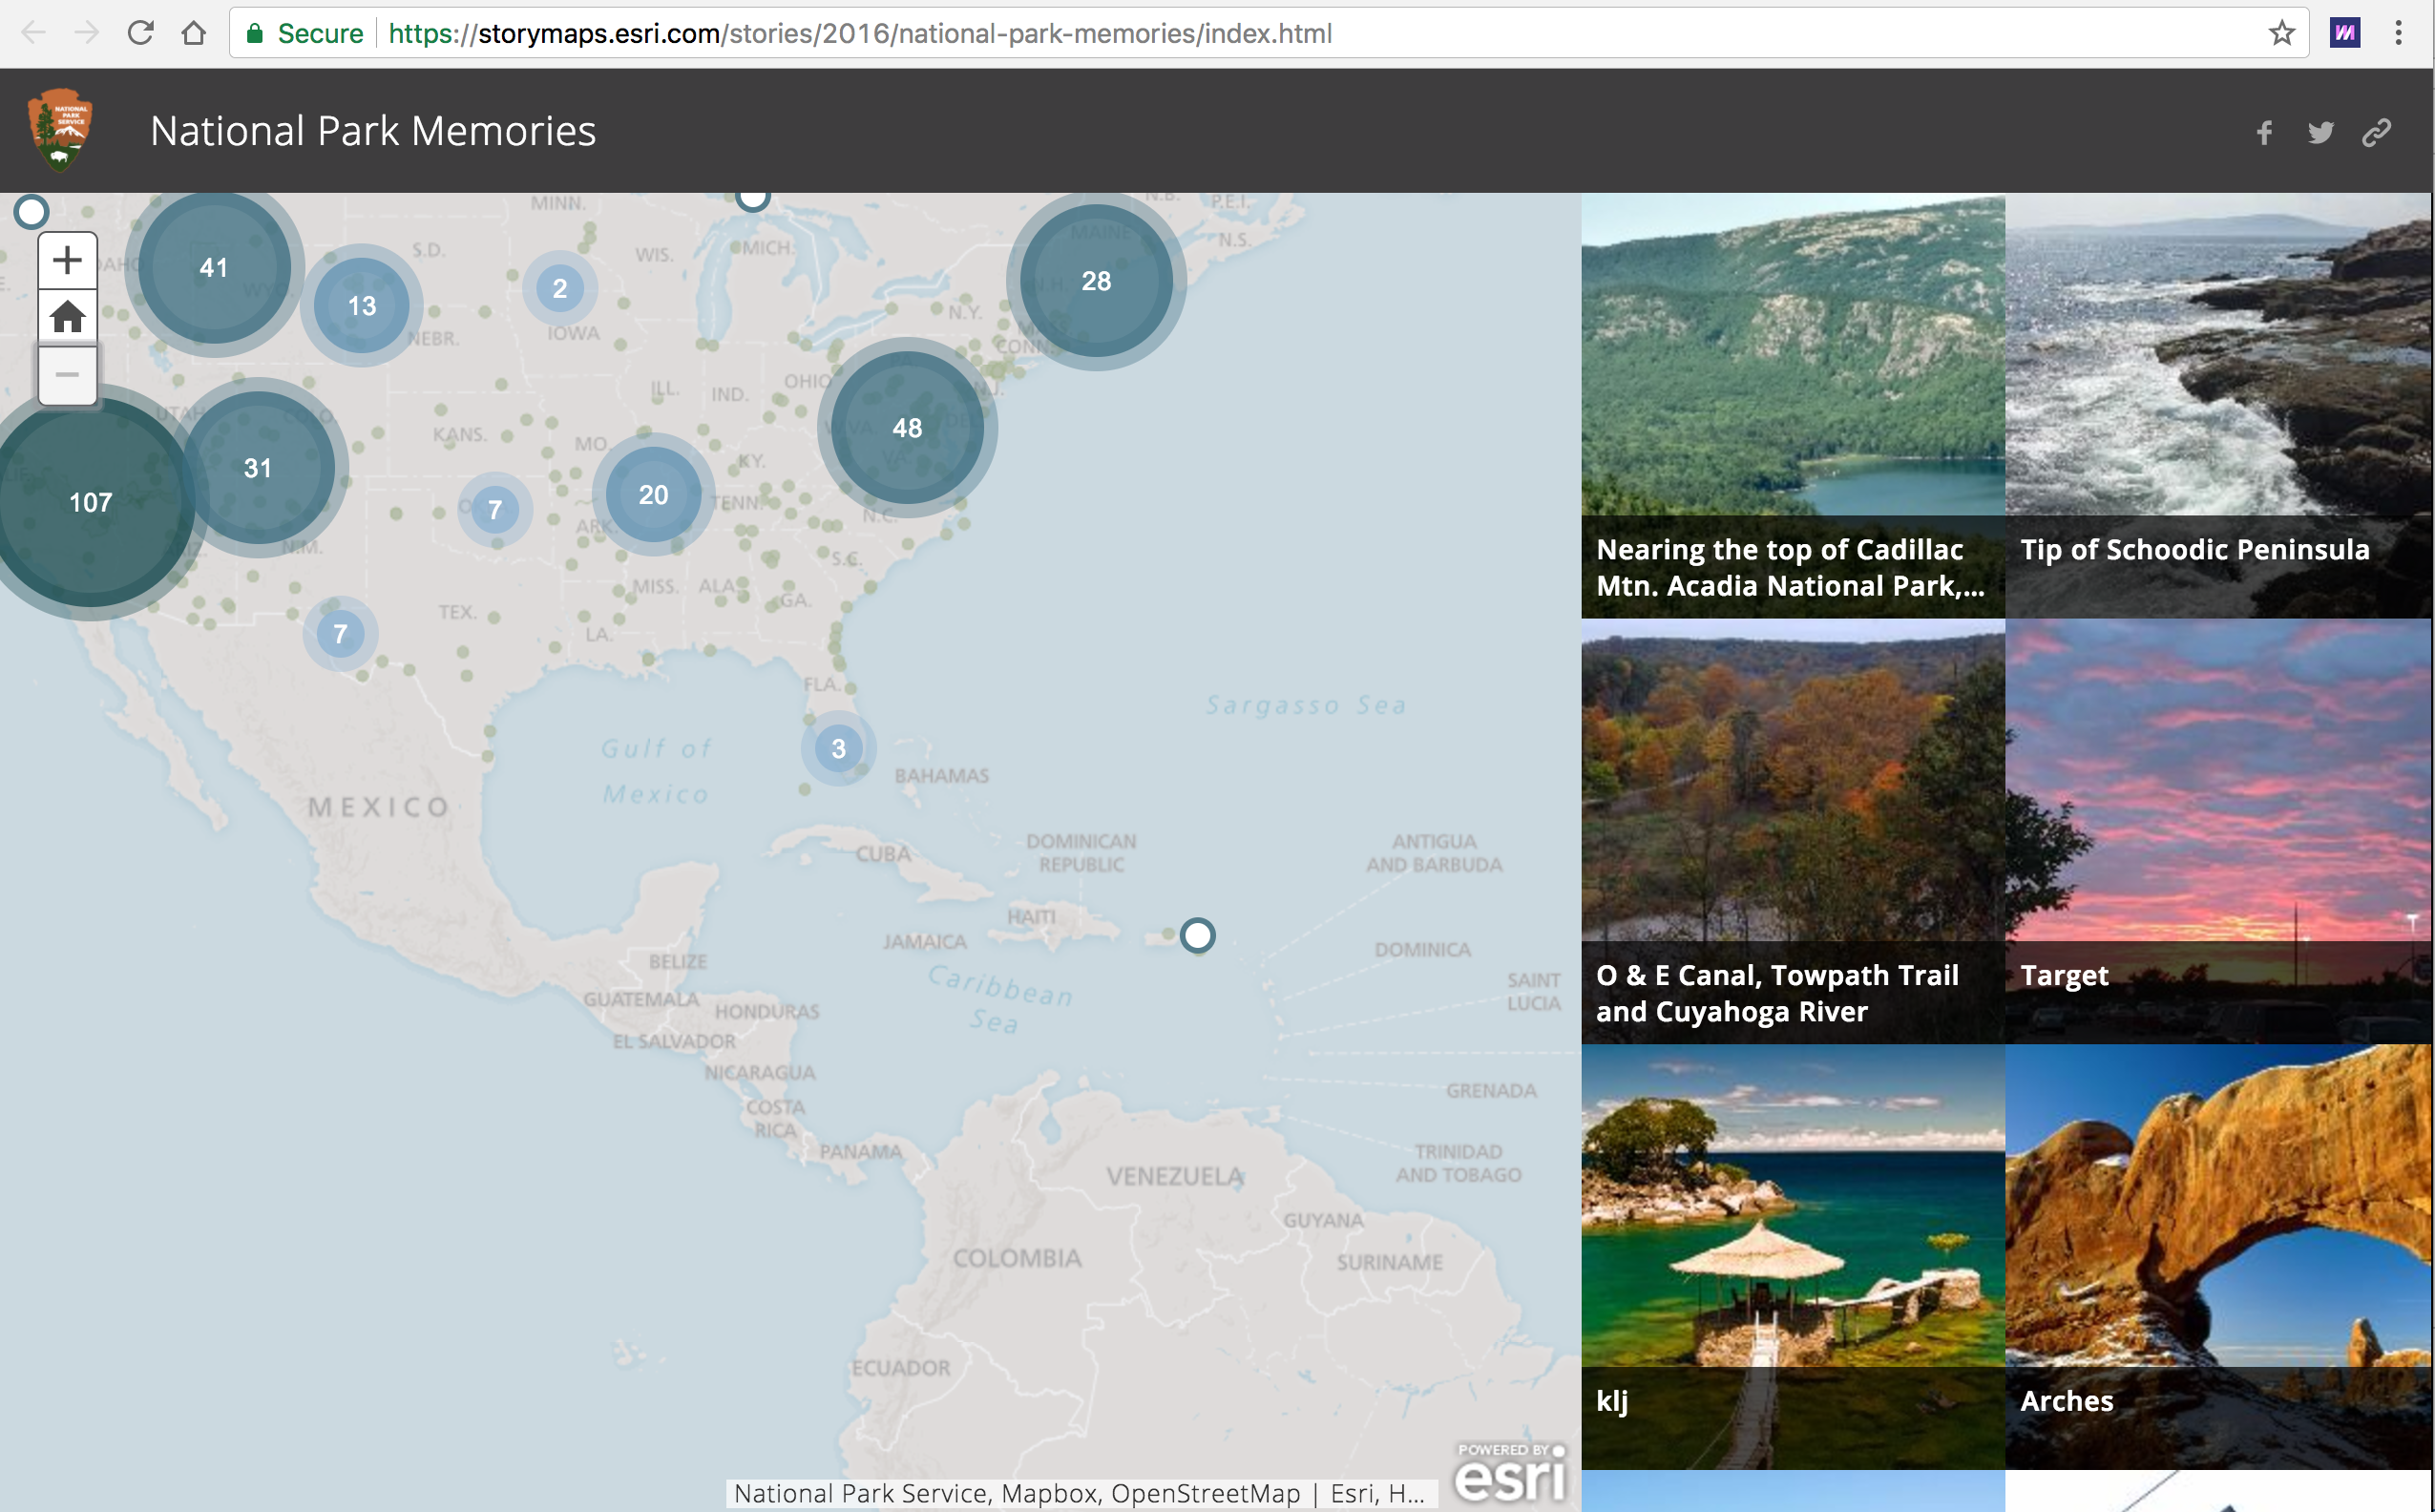
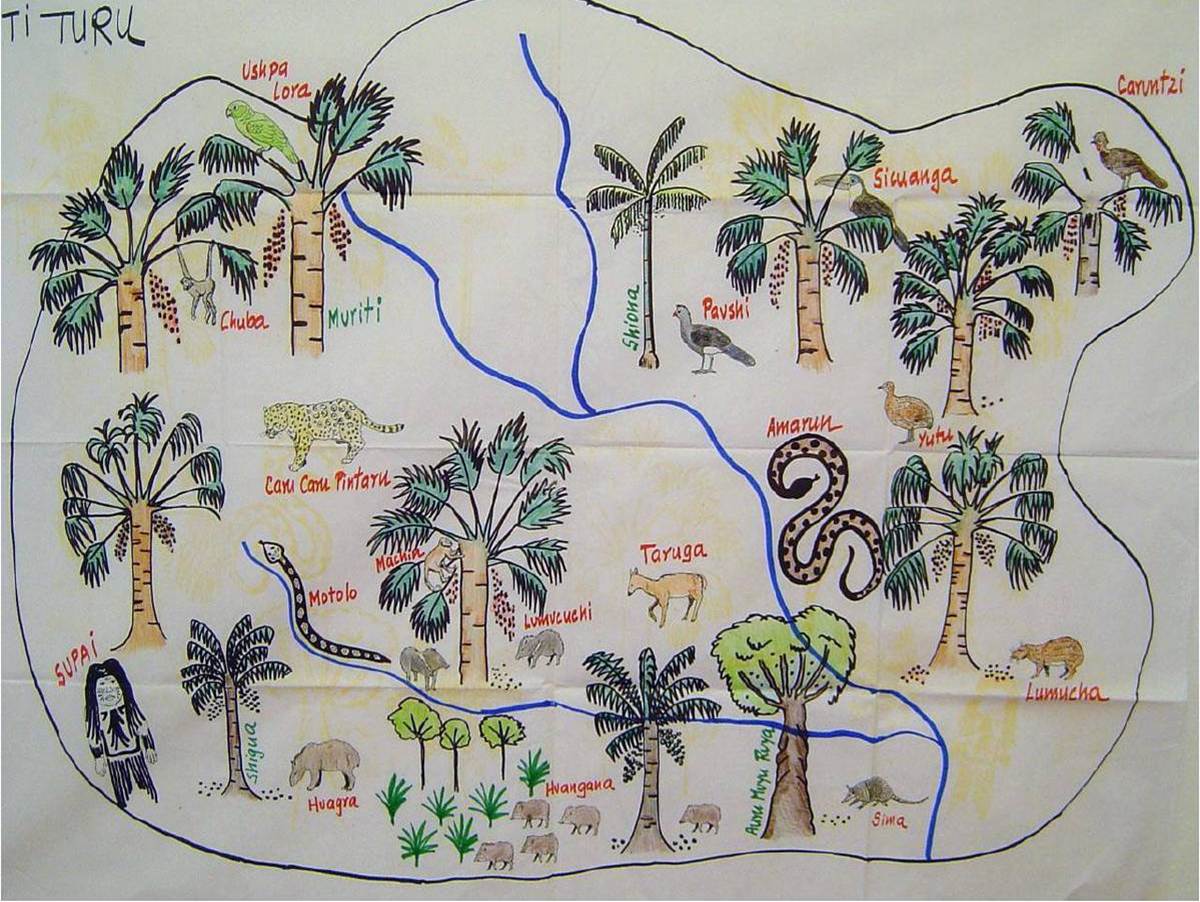
Maps vary in style and purpose, rom accurate maps overlaid on satellite base maps, such as those shown above, to story-telling concept maps, such as this example of Participatory Ecosystem Mapping in Kichwa communities of Ecuador under the guidance of Alfredo Vitery, Ecuador, and Wendy Pineda, Perú.
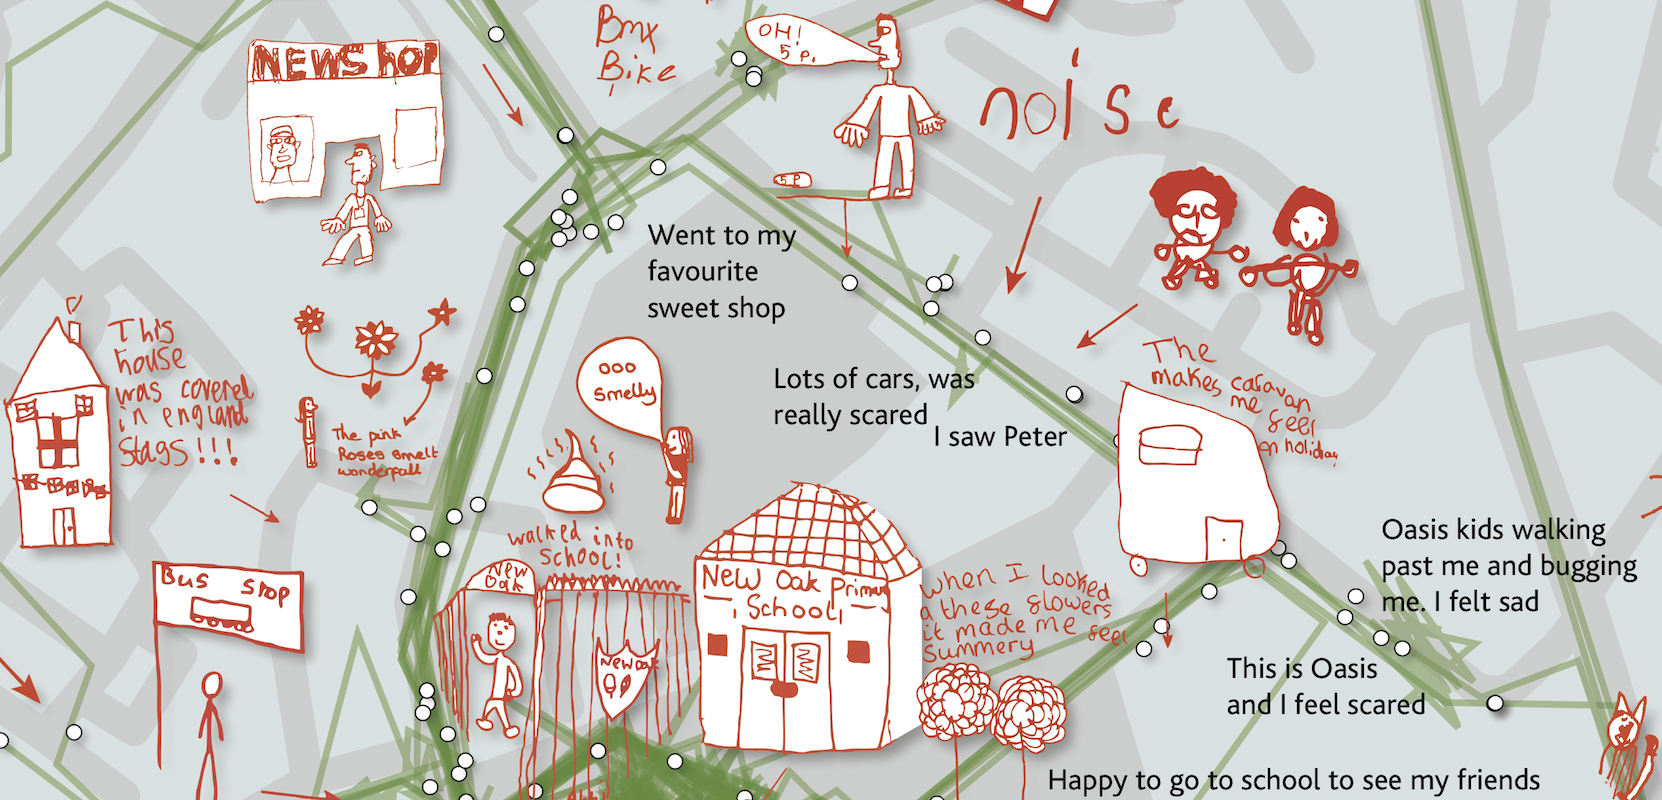
Maps are a tool that can be technically annotated and linked to a back end database, or can engage storytellers, not only among indigenous tribes but including school children, such the Collective Sensory Experience Map, New Oak Walking Map assembled by map artist Christian Nold, who works with the local community to creat his maps.
The greatest challenge is to develop a hybrid between the two extremes of “indigenous people tell their stories via maps” and the high-tech for experts-only maps, i.e. maps that tell stories backed up by accurate data that can be filtered and clustered to address different questions. The Climate Data Explorer of the World Resources Institute is a powerful exemplar of that job well done.
The interactive map below, developed by earthDECKS team member Assen Assenov, shows interlocking, co-dependent townships in the San Francisco Bay Area. Click on any area to see the name of the township and to zoom into or out of the map. To return quickly to this Bay Area map, reload the page.